

Marketing for D2C brands, industry by industry
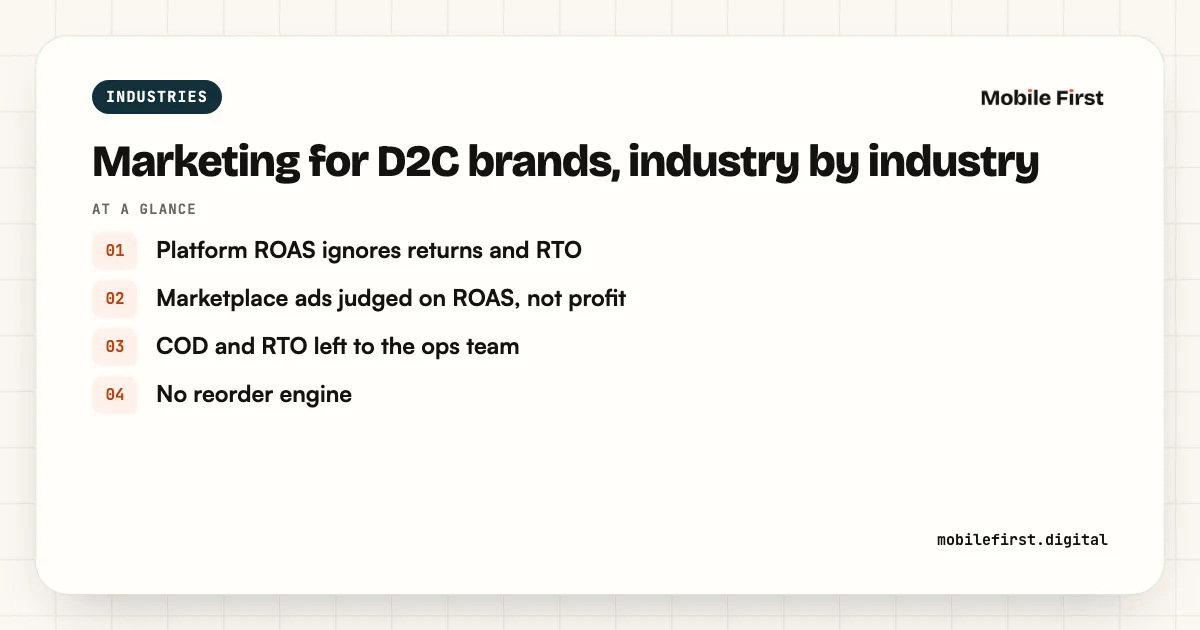
Where D2C and e-commerce brands lose money, and how we fix it. Categories differ, but the leaks repeat. Here are the six we see most, then the 13 categories we know best.
Services
All servicesMore
IndustriesResultsHow we workPricingFree toolsAboutContactWhere D2C and e-commerce brands lose money, and how we fix it. Categories differ, but the leaks repeat. Here are the six we see most, then the 13 categories we know best.
Dashboards count an order when it is placed. Returns and RTO arrive weeks later.
Fixed by tracking and measurementCommission, fees and returns never reach the console's ROAS number.
Fixed by marketplace and quick commerce adsMarketing chooses who to target. Ops pays for the orders that come back.
Fixed by website conversionAds tire in two weeks. Four videos cannot keep up.
Fixed by creatives and creatorsWithout flows, every repeat sale is bought again with ads.
Fixed by retention marketingTracking set up once and never tested against real orders.
Fixed by tracking and measurementApparel RTO averages 25 to 40%; ethnic wear runs 30 to 45%.
How we grow fashion brands$129B packaged food (2025)About 16 to 17% of India's e-retail spend went through quick commerce in 2025 (Bain).
How we grow food brands$91B market, 8 to 10% online (2025)Jewellery has one of the lowest RTO rates, 4 to 12%, so trust and photography decide conversion.
How we grow jewellery brands₹52,000 Cr online beauty (2025)COD returns run 18 to 22%, mostly 'not as described' and skin sensitivity.
How we grow beauty brands$6.7B sold online (2025)Size problems drive over 60% of footwear returns.
How we grow footwear brands₹78,800 Cr market (FY25)Prescription glasses are about 73% of eyewear sales by value, so the lens and power step decides online sales.
How we grow eyewear brands$6.1B nutraceuticals, 11% a yearSupplement RTO is 6 to 14%, usually flavour or claims mismatch.
How we grow health brands$6.3B kitchenware (2024)Home furnishing RTO is 10 to 25%, driven by transit damage and size fit.
How we grow home brands$5.7B baby care, to $11.4B by 2032Baby care is growing about 13% a year; parents look for dermatologically tested products.
How we grow kids brands$770M pet food, 31.6% onlineUrban pet parents now spend ₹5,000 or more a month on pet care.
How we grow pet care brands$9.5B sportswear (2025)Activewear RTO runs 15 to 28%, mostly fit and fabric.
How we grow sports brands₹14,500 Cr+ mattresses, 8% onlineOffline stores still sell 56% of mattresses in India.
How we grow sleep brands$89.5B consumer electronics (2025)Electronics RTO is 8 to 18%, mostly variant errors and expectation gaps.
How we grow electronics brandsMarket sizes: IMARC Group and industry reports, 2025. Insights: Base RTO benchmarks 2026, Redseer, IMARC, Market Xcel.
Good fit
Not a fit
If you sell online in India, very likely. The 13 categories here are where we go deepest, but the six leaks above apply to every D2C and e-commerce brand.
We work with any D2C or e-commerce brand selling in India. Book a call or take the free audit, and we will tell you plainly whether we are the right team for your category.
We may work with other brands in your category, but never on the same senior marketer's desk as you.
Yes. Marketplace and quick commerce ads are one of our seven services, run by specialists who work on Amazon, Flipkart, Myntra, Blinkit and Zepto every day.
We work with any brand selling in India, whether it is Indian or international.
Each of the 13 industries on this page has its own page with the season, channels, creative angles and audit checks we use for it.
No. What matters is your monthly revenue and your margins, not the size of the category.
Yes. Each page shows when demand peaks in that category, so stock, creative and budget can be planned around it.
Yes. Our creators make ads in English, Hindi and regional languages.
We check margin after returns by product, RTO by pin code and how much of revenue depends on ads. Each industry page lists the three checks we start with.
Five questions, no email needed. You get an honest answer on screen.
Great fit
Book 30 minutes and we will read your accounts before the call.
Book a callGood fit
You keep the findings either way.
Book a callNot yet
Our free tools will show you where your money goes today. When you cross ₹5 lakh a month, come back and we will read your accounts. If you would like advice before then, we are happy to talk.
Tell us about your brand. We read your accounts before the call, so it is about your numbers.